Real-time Dashboard
A page for real-time analysis of your website traffic shows information about all visitors of your website on-line.
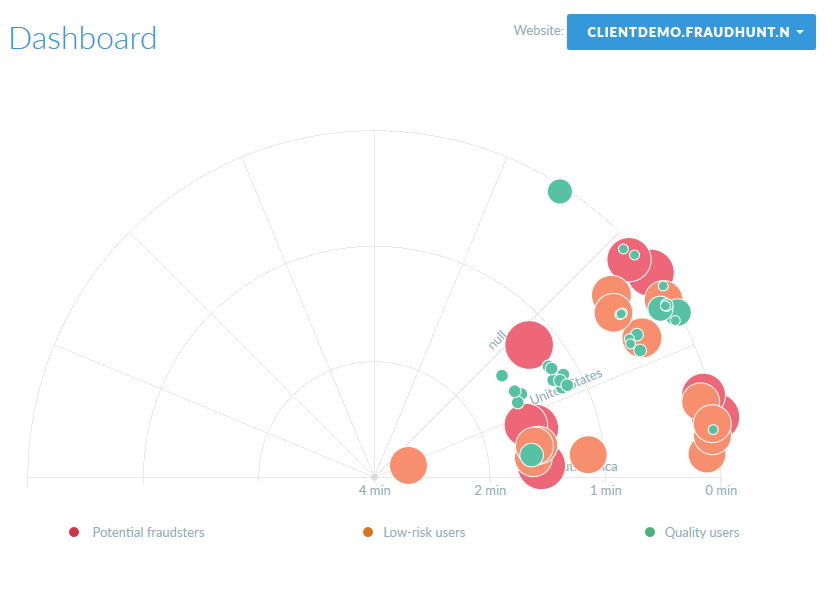
The radar shows all active users and their respective Fraud Scores, it is divided into sections according to the country, where the user has come from. The longer your user stays on the website, the closer to the center a conventional radar dot gets. The size of the dot is based on the Fraud Score of each user (bigger dot means less quality). The same rule works with the color of the dot (lowest quality users are represented with reddest dots).
Quality – 0 – 50
Low-risk – 51 – 75
Potential Fraudsters – 76 – 100
User Info
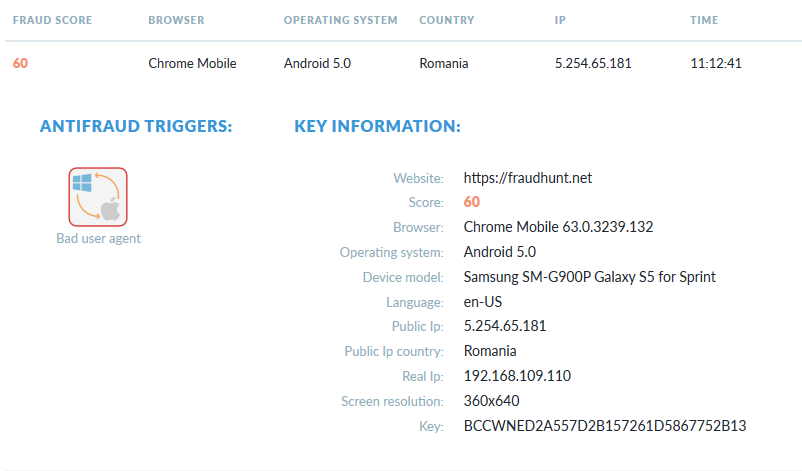
The block below the radar contains detailed information about the users displayed on it. The users are displayed in reverse order, from the lowest quality to the highest quality users. If you click on any entry, you will see a table containing detailed analysis of the user.